PRODUCT HISTORY
PRODUCT OVERVIEW
BenderRBT Release 8 What's New?
The earliest version of automation support for the RBT process goes back to 1970 in IBM. William Elmendorf of the Poughkeepsie Labs developed a system called TELDAP (Test Library Design Automation Program). It was written in APL and brought the largest mainframes IBM had to their knees. Mr. Elmendorf is one of the short list of fathers of black box testing. He is the initial developer of equivalence class testing with boundary analysis.
In 1980 one of our clients, Bank of America, created another mainframe version called CEGAR (Cause Effect Graphing Analysis Routine). Hitachi in Japan, another of our clients, also created yet another proprietary version in 1981.
By 1987 PC technology made it economically viable to create a desk top version. William Elmendorf left IBM and joined in partnership with Bender & Associates to create a whole new incarnation, initially called SoftTest. By 1991 Mr. Elmendorf decided to retire. Bender & Associates became the sole owner of SoftTest.
In 2002 the product was renamed BenderRBT (the RBT standing for Requirements Based Testing) and the company renamed to Bender RBT Inc.
In 2005 a new component called Quick Design was added which supports three additional test design engines based on Pair-Wise Testing.
In subsequent years various improvements were done refining the graphical front end to aid in drawing the cause-effect graphs, add to the exports, and refine the test design engine. Release 8.0 is the most significant release since Release 1.0 of the SoftTest version. The Cause-Effect Graphing test design engine was totally redesigned to take advantage of advances in the algorithms in path sensitizing from the hardware world. Major features such as Neoning were added to allow the tester to manually set the states of nodes on the graph and see the states extrapolated forwards and backwards within the graph. Scalability was addressed to aid in the long term integration with playback tools, test library managers, and requirements managers. Exports were expanded to include the OMG’s TestIF as well as rich text formats of any of the text based reports. RBT now supports all languages for user defined inputs – e.g. the user can enter the Title, Node names, Node descriptions, and Notes in Mandarin.
PRODUCT OVERVIEW
Requirements-Based Testing
Bender RBT Inc.'s BenderRBT is a requirements-based, functional test case design system that drives clarification of application requirements and designs the minimum number of test cases for maximum functional coverage. By thoroughly evaluating application requirements for errors and logical inconsistencies, BenderRBT enables project teams to refine and validate the requirements earlier in the development cycle. The earlier in the cycle requirement errors are found and corrected, the less costly and time-consuming they are to fix. BenderRBT uses the requirements as a basis to design the minimum number of test cases needed for full functional coverage. BenderRBT then allows project teams to review both the requirements and the test cases in a variety of formats, including a logic diagram and structured English functional specification, to ensure that the requirements are correct, complete, fully understood and testable.
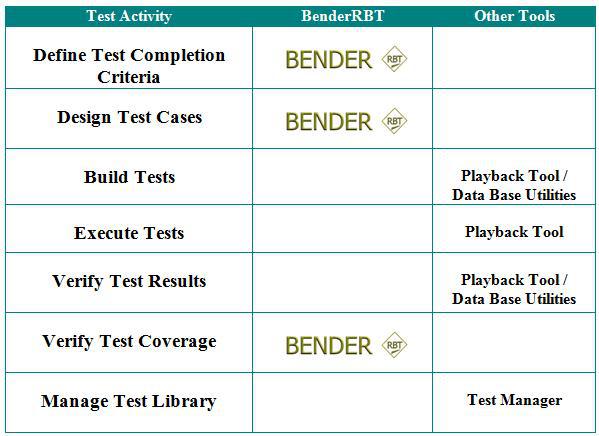
Most testing activities, and the tools that support them, can be divided into the following seven activities:
- Define Test Completion Criteria
- Design Test Cases
- Build Test Cases - Including scripting and data provisioning
- Execute Tests
- Verify Test Results
- Verify Test Coverage
- Manage the Test Library
BenderRBT addresses defining the test completion criteria, designing functional tests to meet the necessary criteria, verifying the test coverage, and assists in verifying test results and in maintaining the test library.
Feature/Benefit Table
| Highly optimized algorithms |
|
| Automated test case generation |
|
| Quantitative test completion criteria |
|
| Natural language test cases |
|
| Target platform independent |
|
| Coverage analyzer |
|
| Flawed logic detection |
|
| Capture/playback integration |
|
| Coverage matrix |
|
| Definition matrix |
|
| Functional specification generation |
|
| Logic diagram |
|
| Integration with requirements management |
|
| Integration with playback tools and test library managers |
|
| Synergy with code coverage monitors |
|
Choice of Two Test Design Methods
BenderRBT comes with two distinct test case design engines. When you invoke RBT directly you will be given a choice of which you would like to use.
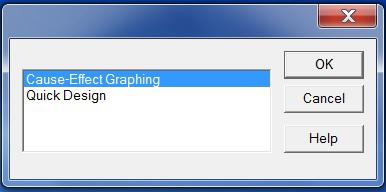
RBT Test Design Engine Options
Cause-Effect Graphing (C-E Graphing) takes you to the Graphing based test engine. Quick Design (QD) takes you to the Pairs-Wise based test engines. This includes Orthogonal Pairs and Optimized Pairs. C-E Graphing is intended for business critical, mission critical, and/or safety critical functions. It ensures that you not only got the right answer, but that you got the right answer for the right reason. It addresses the fact that multiple defects can sometimes cancel each other out. C-E Graphing ensures that defects are propagated to an observable point where testers can see the problem. QD is aimed at testing user interfaces (e.g., web pages, screens in client server applications. It is also applicable in designing configuration tests and quick shake-downs of even critical functions. Both C-E Graphing and QD address reducing the nearly infinite number of potential tests down to small, highly optimize test libraries. They both have full constraint rules support (One and Only One, Exclusive, Inclusive, Requires, and Masks) to ensure that the tests created are physically possible while still supporting full negative testing.
BenderRBT Cause-Effect Graph Based Test Design Engine
Better Requirements
Developing high-quality applications begins with the requirements. Requirements must be deterministic and unambiguous in order to ensure that the application is developed and tested accurately. RBT assists project teams in analyzing and reviewing the application requirements to eliminate logical inconsistencies and errors. Using cause-effect graphing, an innovative approach which graphically displays relationships and constraints between application nodes (inputs and outputs), the project team can analyze every aspect of the functional requirements in RBT. RBT then evaluates the recorded information to identify precedence problems in relations and logical errors. RBT provides detailed analysis information in a variety of easy-to-read formats. Analysts and project stakeholders collaboratively can review the natural language test cases generated by RBT, enabling them to identify and correct any requirement errors earlier in the development cycle.
Cause-Effect Graphing
A proven technique for effective requirements validation and test case design, cause-effect graphing is the process of transforming specifications into a graphic representation. This graphic representation depicts the functional relationships and conditions present in the requirements, illustrating how each input relates to every other input, as well as every output. Constraints and observability of nodes also are established during this process, allowing the project team to identify potential problem areas. In developing the cause-effect graph, the test team evaluates the requirements for completeness, consistency, sufficient level of detail and lack of ambiguity, often finding defects that otherwise would not be found until integration testing.
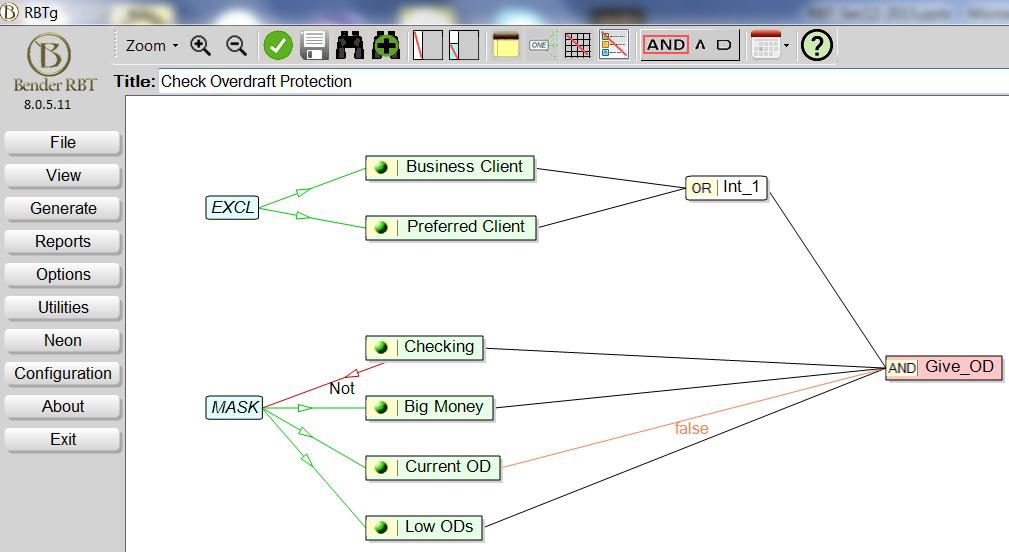
BenderRBT's Graphic Front-End
The graphic front end to RBT allows project teams to quickly create cause-effect graphs, complete with node relationships, constraints, and attributes. When a node is created, users are prompted to enter the required attributes, reducing the risk of incompletely defined nodes. When the cause-effect graph is completed, RBT then designs the test cases based on the requirements depicted in the graph. RBT also uses the cause-effect graph to further evaluate the requirements for logical consistency. The project team can use the test cases generated by RBT to review requirements with stakeholders, or they can use the structured English requirements document automatically generated by RBT. The more readable the requirements are, the more likely the project team is to develop the right application.
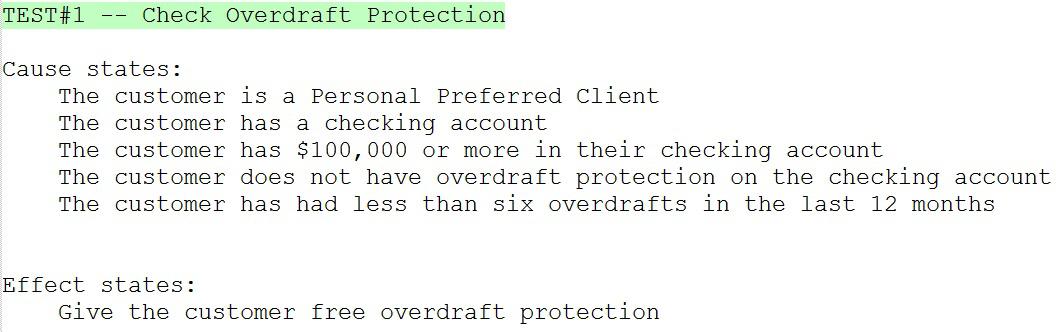
BenderRBT's Script Test Definitions Report details every step of the test cases designed, including the input conditions and the expected results (or effects) of each step.
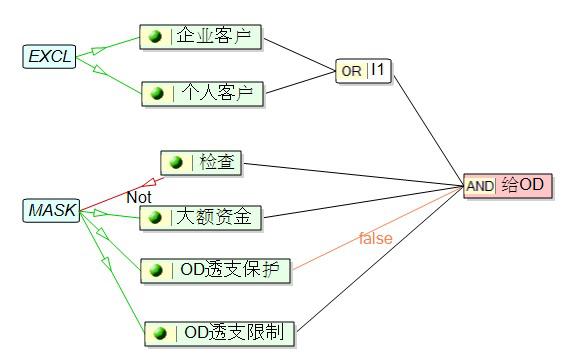
Localization Support
All of the user entered information - Graph Title, Notes, Node Names, Node Descriptions - can be entered in any language. RBT will then generate the all of its output using this information. Here is the above graph built using Chinese:
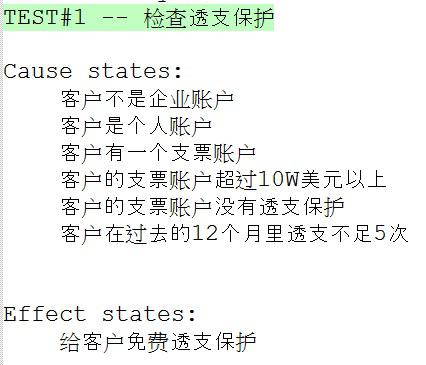
Here is an example of a test generated:
Minimum Tests
In many testing environments, tests are developed using “gut feel” or combinatorics-based methods. Gut feel testing relies on individual testers to develop the tests to be used, while combinatorics-based testing uses all possible combinations of the inputs. While these test development methods are widely used, they do not ensure full functional coverage, let alone guarantee the minimum number of required tests. BenderRBT uses a mathematically rigorous algorithm to determine the minimum number of test cases required for full functional test coverage.
For instance, in an application with 37 inputs, an exhaustive combinatorics-based approach will result in over 130 billion possible test cases. A gut feel testing approach might reduce this number to 50 or 100 tests, but there is no way to know whether they are the right tests for the application. Because the skill level and experience of the individual testers may vary, there is no way to guarantee a high level of functional coverage. In this example, RBT reduces the possible number of test cases to only 22 in a one second. Since these tests are based on the actual, documented requirements, the test team will be testing 100% of the application's functionality. This minimum set of tests cases also significantly decreases the amount of time required to design and build tests, reducing the overall testing effort.
In every comparison study our clients have done over the years, RBT has reduced the number of necessary tests by a minimum 4X for equivalent coverage. For groups just using “gut feel” testing it has been closer to a 10X reduction.
Maximum Coverage
Using a gut feel test design approach, the test team can not be sure that their tests cover 100% of the application's functionality. In fact, studies have shown that in gut feel testing environments, the tests only cover an average of 30-40% of the application's functionality. RBT's proven automated test case design approach ensures that the functional test coverage will achieve 100%, with the minimum number of tests. RBT carefully evaluates all of the cause and effect information it is given to reduce the possible number of test cases to a minimum set that is functionally complete. RBT also cross-references the functions with the test cases. When evaluated with the status of executed tests, this information allows the project team to calculate the percentage of functionality running correctly. Management then can make an informed decision about whether the application is ready for production.
Protecting Your Investment In Test Cases
The Cause-Effect Graphing process is an iterative one. You generally graph, review the results, and tune the graph until you are sure the requirements are solid and that the graph reflects those requirements. You then implement the test cases. When you commit to building the executable tests you want to ensure that RBT knows that this set of tests is the one you are implementing. This will allow you to protect your investment in these tests.
If RBT if aware of existing tests, it can evaluate those tests as the requirements and graph change. How much coverage do the old tests give you? What new tests will you need? What modifications have to be made to the old tests? RBT can answer those questions for you.
Therefore, RBT gives you a number of options in generating test cases.
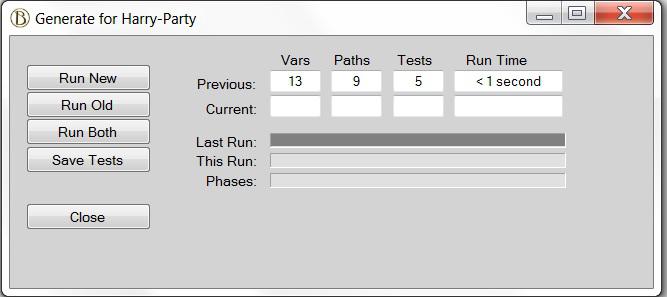
The Run New option will design a new set of tests based on the graph you have just entered.
The Run Old option will evaluate the coverage of a set of existing tests against the current version of the graph.
The Run Both option will evaluate the coverage of a set of existing tests and then supplement these tests to complete the coverage of the graph.
Note: This feature can be used to factor in test cases that were not designed by RBT. There is a dialog for allowing the user to tell RBT about existing test cases, regardless of their source.
Matrix Views
When planning the testing phase, it is important to understand the functional coverage of each test case, as well as the state of each node in each test case. RBT provides two matrix views that show this information in detail. The Coverage Matrix shows which functional variations are covered by each test. It also illustrates that every test exercises at least one functional variation not covered by any other test. Using this matrix, the test team can be sure that they are testing 100% of the application's functionality. RBT's Definition Matrix summarizes the input and output conditions included in each of the test cases generated by RBT. Both of these matrixes may be exported to Excel for further annotation by the tester.
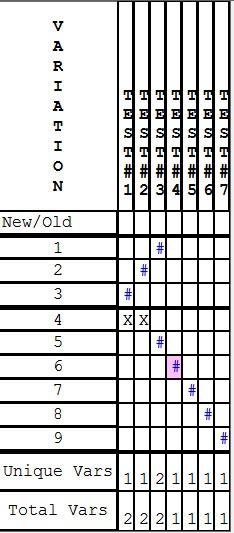
BenderRBT's Functional Coverage Matrix identifies which functional variations are in which test cases. An “X” means that the variation is in two or more tests. A “#” means the variation is only in one test.
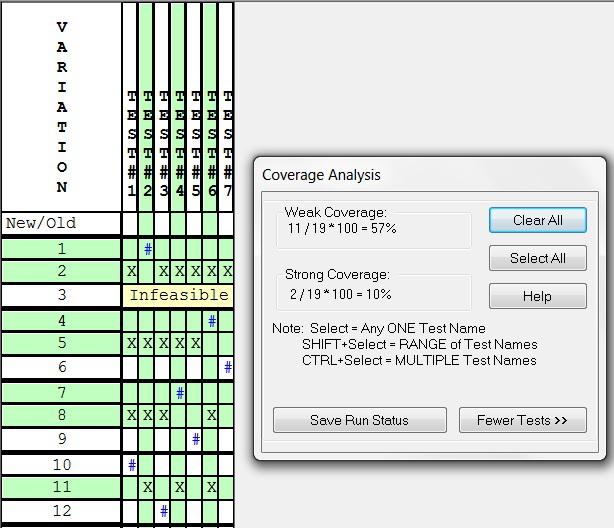
BenderRBT's Coverage Analysis Matrix allows the project team to quantifiably determine the status of testing. When one or more test cases are selected, the Coverage Analysis function calculates the selected test cases' percentage of weak and strong functional coverage.
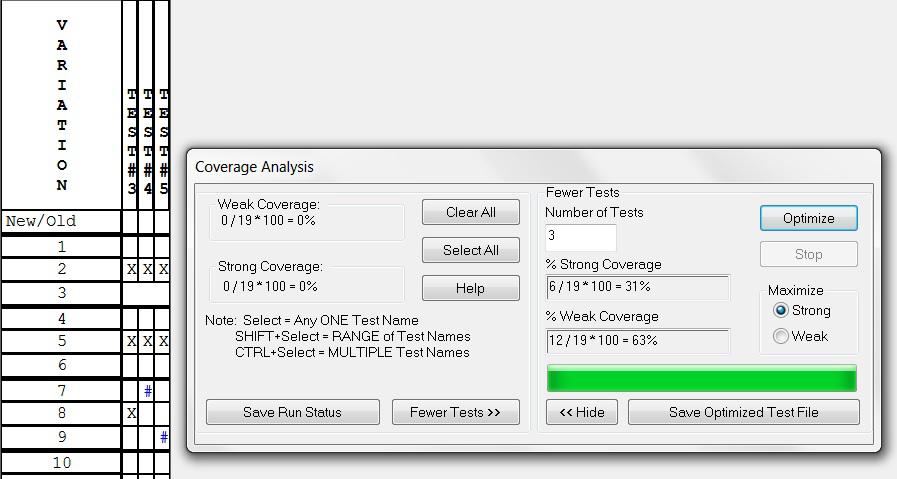
Fewer Tests Dialog
This feature allows you to enter in a number less than or equal to the number of total tests and have RBT determine which is the optimal subset of tests - i.e. which tests would give you the greatest possible coverage.
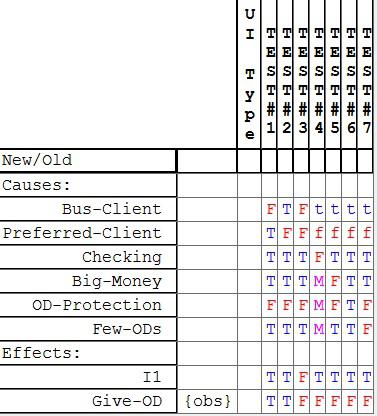
BenderRBT's Definition Matrix uses a table format to display the state of each node in each test case, allowing at-a-glance understanding of each test case.
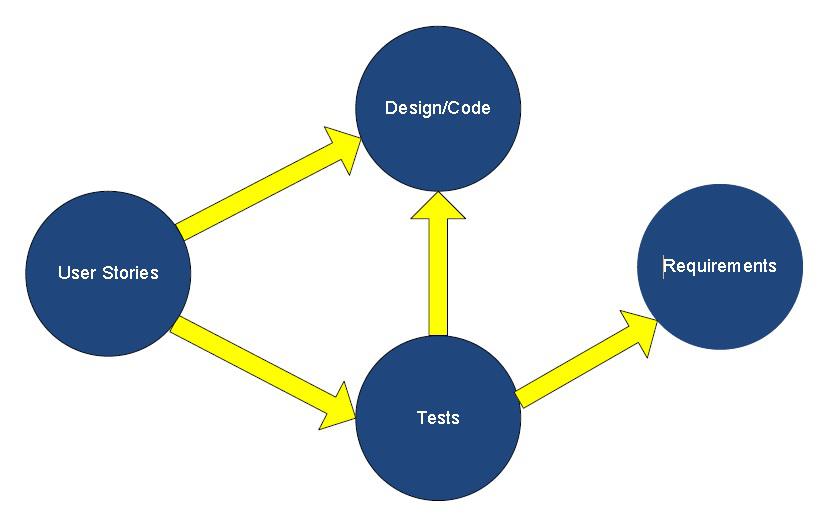
Strong Support For Agile
Agile projects are highly iterative within and across releases. Common problems on agile projects are that tests are often a sprint behind and specifications are never fully documented. In addition to the ability to protect the investment in tests implemented from prior versions of the graphs, RBT can generate a Functional Specification from the models.
This user story from a dental insurance application:
Determine the amount to be paid for each dental insurance claim."
Resulted in this Cause-Effect Graph:
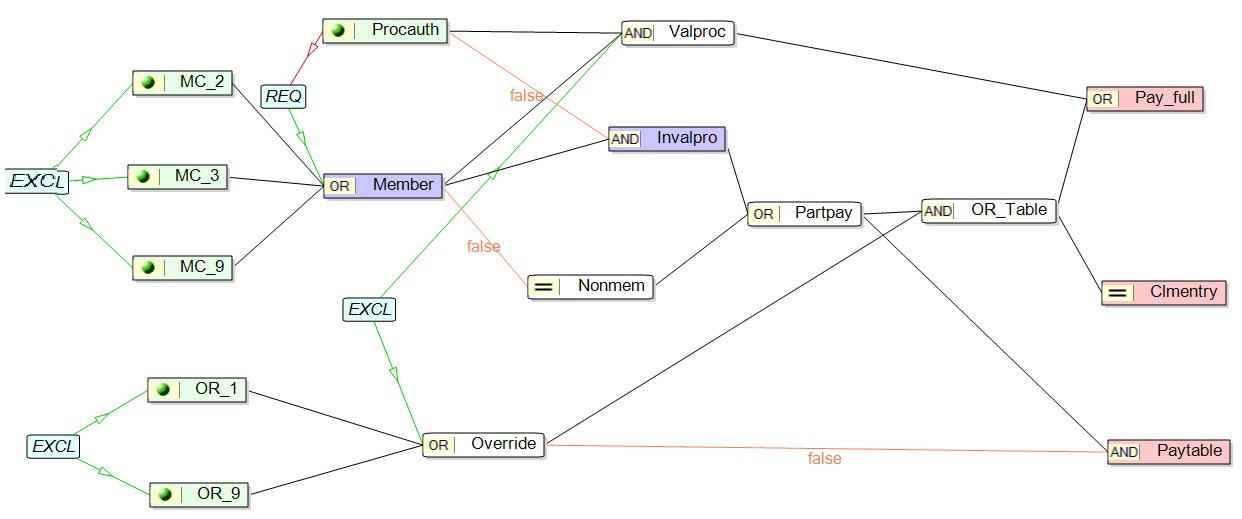
Which in turn generated tests such as:
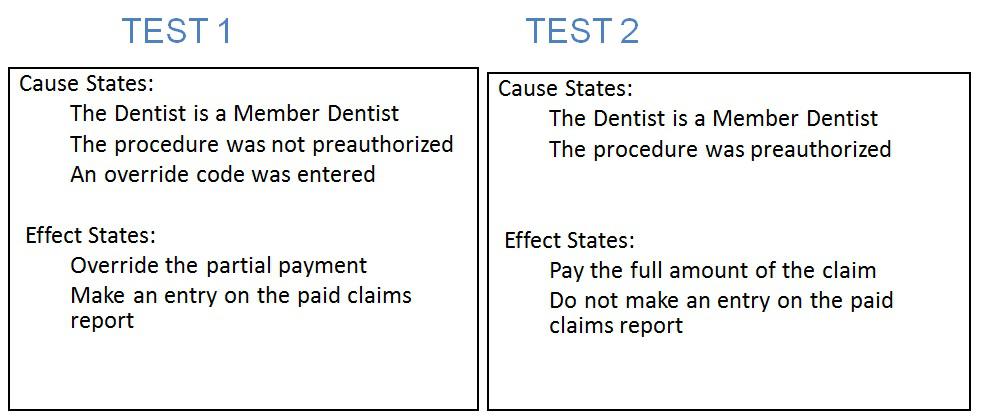
And generated this Functional Specification:
This ensures that the code, the tests, and the specifications are all provably in sync at the time of the release.
Quick Design has multiple test case design engines, all based on Pair-Wise testing. One is used for Orthogonal Pairs - create a balanced set of tests with pairs in equal numbers of tests to the extent possible. This is used fro designing tests for configuration testing and for creating seed tests for performance testing. The two other engines are for Optimized Pairs testing - cover the set of pairs with the minimal number of tests.
Quick Design allows you to design tests in just minutes. You just identify each test input Variable. For each Variable you define the States you want to test.
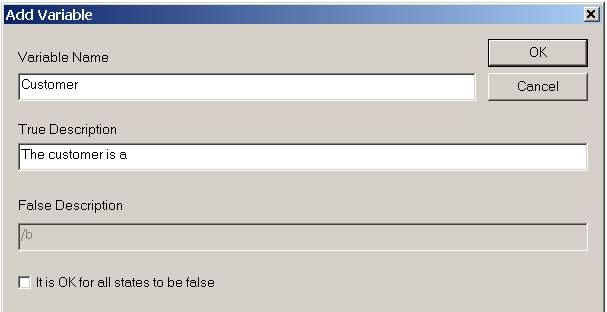
Defining a Variable in Quick Design
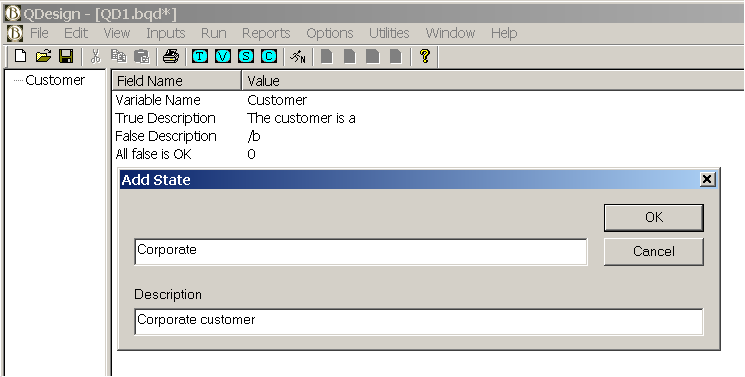
Defining a State in Quick Design
QD concatenates the Variable description with the State description in the generated test scripts. This saves typing and ensures consistent wording of test scripts. In the above example the final description would read "The customer is a Corporate customer".
If needed, you then apply constraints across the Variables/States which identify combinations of data which are physically impossible at this point in the system. However, you still want to do full negative testing.
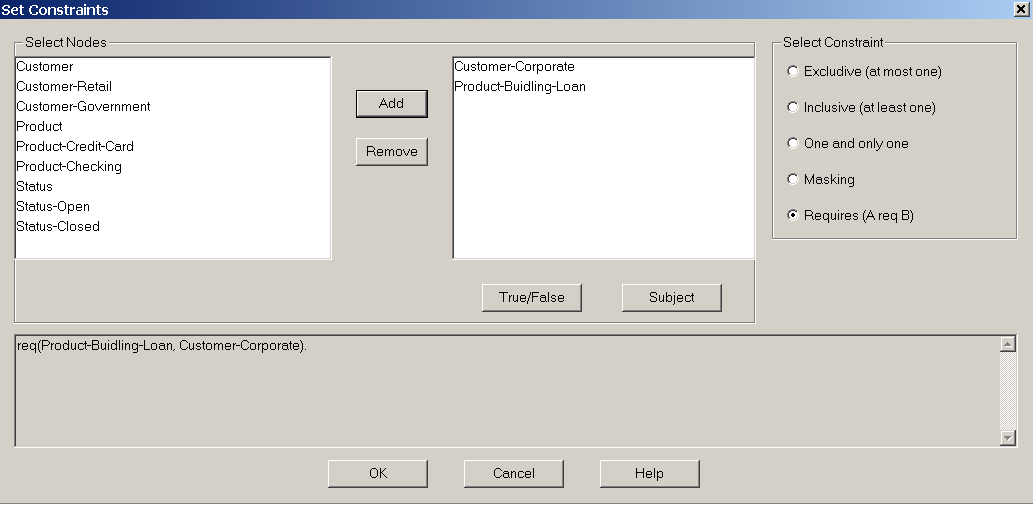
Defining a Constraint in Quick Design
In this example the constraint rule is that only corporate customers may have building loans. Other functions prior to this one would have rejected any attempt by retail customers or government customers from getting this type of loan. The production data base would not contain any building loans for any customer other than corporate customers. Therefore, we do not want to generate any tests at this point contrary to this rule. Note, however, that in testing the predecessor functions you should have tried creating a building loan for the other customer types. The test result should have been that the loan application was rejected.
Quick Design then generates all possible pairs across the Variables/States. This is documented in the Pairs Report.
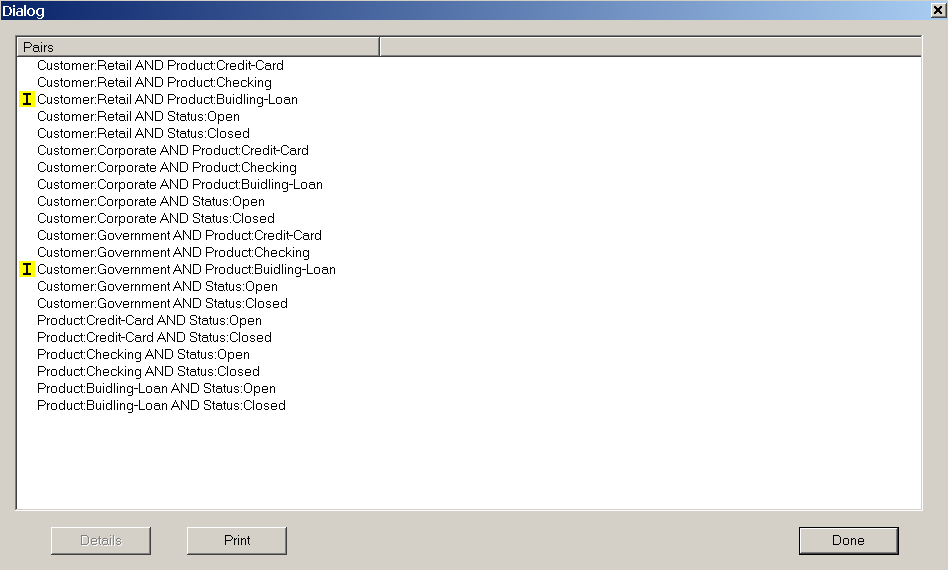
Quick Design Pairs Report
Note that two of the pairs have a yellow "I" next to them. These are the infeasible pairs - i.e. they violated the constraint we set up.
Quick Design then merges the pairs into tests, again ensuring that no constraints are violated. You have two choices in generating tests: Orthogonal Pairs or Optimized Pairs. In Orthogonal Pairs testing each pair occurs the same number of times across the set of test cases. In Optimized Pairs each pair is in at least one test. The goal is to do this in the fewest number of tests possible. We generally recommend orthogonal pairs for configuration testing and optimized pairs for function testing.
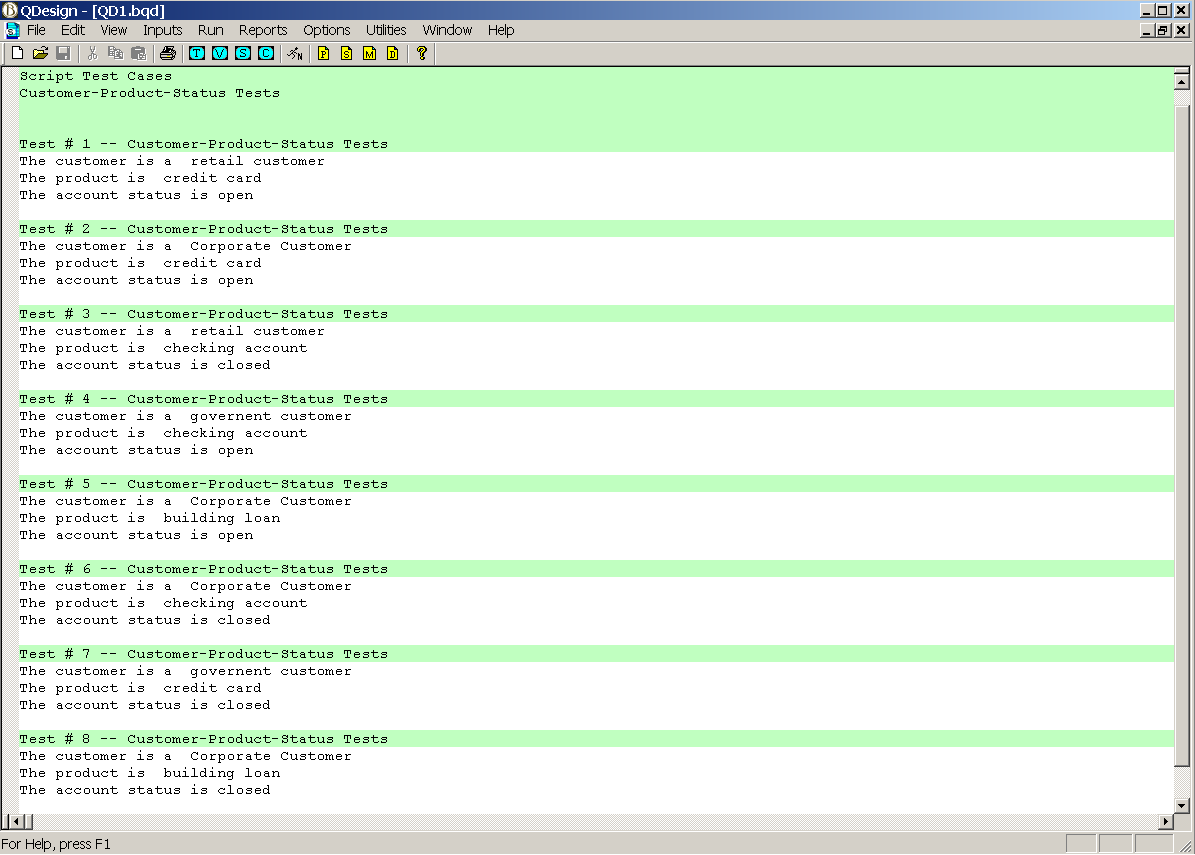
Quick Design Test Scripts Report
As in the Cause-Effect Graphing component, you have the options of creating new tests, evaluating old tests, supplementing old tests as needed, and revising descriptions. You can also define pre-existing tests not created by Quick Design.
As in Cause-Effect Graphing, you get the coverage report.
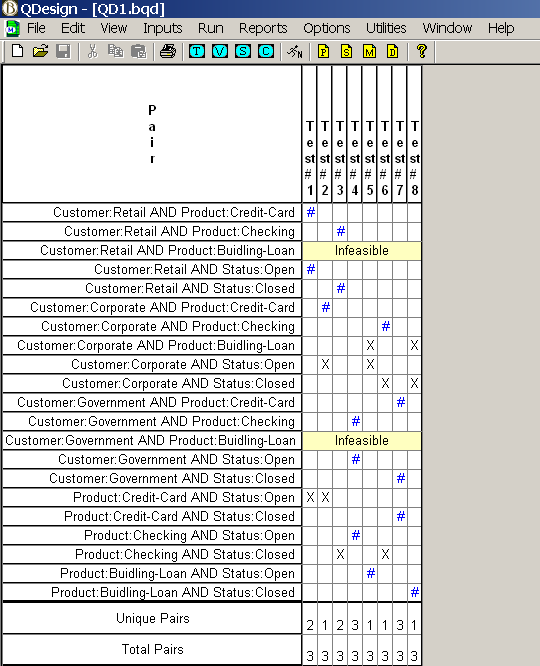
Quick Design Pair Coverage Report Optimized Tests
Quick Design also has a utility to calculate coverage based on which tests passed. You can also define subsets of the set of tests with maximum coverage.
You also get the Test Definition Matrix.
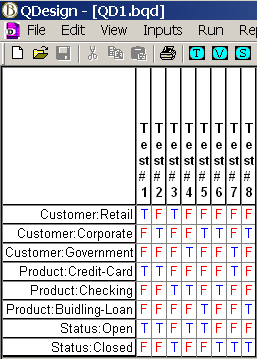
Quick Design Test Definition Matrix
33. Minimum System Requirements
- Windows XP, Vista, Win7, Win 8, Win10
- 128 Mb RAM
- 30 Mb hard disk space for the programs, documentation, and examples
- Free disk space for work files (amount of free space required will vary by organizational needs)
BenderRBT Test Case Design Tool – Release 8.0
Cause-Effect Graphing Test Case Design Component
- Neoning: Neoning is a powerful tool for analyzing your graphs. It allows you to select a variation or a test and have its states highlighted on the graph. When you highlight a variation you can have it extrapolate the states, forwards and backwards – i.e. the states in the variation imply that other nodes must be at specific states. For infeasible variations when the states are extrapolated the conflicting states are shown in gray. In neoning mode you can also manually set the states of one or more nodes and extrapolate the states of other nodes.
- UI Type: In the Node definition property sheet you can now specify what type of variable the node represents. Defining UI types is totally flexible, allowing the user to specify whatever they want. You might use a generic description such as GUI or data base. You could also be more specific such Customer Data Base. This information is then included in the outputs generated by RBT. This feature improves the integration with playback tools such as Quality Center and data base utilities such as Grid Tools Data Maker.
- Improved Sequence Control for Test Scripts: The sequence of the nodes in the test scripts as produced by RBT was not always in the sequence the tester wanted them in. A number of factors in the test design engine drove the sequencing. You can now control the sequence of the nodes and that will be reflected in all of the RBT outputs.
- Limitations Removed on Node Names and Node Descriptions: The input to the RBT test design engine had always been the CEG file. This was a Prolog syntax text file. Being a simple text file resulted in numerous limitations on what characters could be in the input. You could also not use terms that RBT used as keywords such as Nodes, Constraints, etc., as node names. In the new release the input to the engine is now via XML. Therefore we were able to eliminate all limitations on what is in a node name and node description. For practicality reasons we still limit Node names to 32 characters.
- View/Edit Constraints: In prior releases adding or editing a Constraint could be challenging for very complex graphs. You could get lost in all the line connections. In Release 8 you can now display just the Constraint you are working on while hiding all of the others. You can also display just a subset of Constraints. When you finish editing the Constraint you can then return to the full display mode.
- Queue Manager: In earlier releases you could create and run queues of CEG files from the engine component. In Release 8 you can build and run queues of RBT files from the front end drawing component. The ability to create and run queues is useful when you have a set of graphs that take a while to run. You can set up a queue and then run them over lunch or overnight.
- Scrub: On occasion we have had customers who needed us to review their graphs but were limited in what they could show us due to confidentiality or security reasons. The scrub feature translates all of the node names into the handles RBT uses internally for processing. These are just numbers. The node descriptions are eliminated. The new graph has the same name as the original one with the term “_Scrubbed” appended to it. Therefore the meaning of the nodes is hidden while the structure of the graph remains unchanged.
- Export to Quality Center: The export to HP-Mercury’s test management tool has been updated to cover the latest release of QC.
- Consolidated Data Base: Release 7 and earlier had multiple files – the RBT, CEG, D_B, and CSV files. All of this has now been consolidated into the one XML based RBT file. This makes managing the RBT data much simpler. The consolidated file is also smaller.
- Revise Descriptions is Done Automatically: In prior releases if you change the True/False node description or changed a Node’s name you had to either rerun the model or at least run the Revise Descriptions to update the RBT reports. With the consolidated data base any change to the Node names or Node descriptions is automatically reflected in all of the reports as soon as you Save the changes.
- Improved Integration of the Drawing Component with the Engine: In prior releases when you selected a Report, Option, or Utility from the front end you just went to the CEG file in the back end engine. You then had to select what you wanted from the back end’s menus. When you make a selection now you are taken directly to the Report, etc., you requested.
- Improved Test File Editor: RBT allows you to save a set of tests it created or define a set that already exists. This is used to protect the investment made in implementing the tests from previous releases of your applications. Creating or editing these tests is now a lot easier. It is done using the format of the Test Definition Matrix. You edit or add tests to the Old Tests file by just setting the causes to true or false. RBT extrapolates the states of the effects as you go.
- Run New and Run Old / Run Both Data All Available for Review: In prior releases a Run Old or Run New replaced the data created by a Run New. In RBT 8 both sets of data are available to review. Therefore you can easily see what coverage existing tests have and compare that to what RBT would come up with if it had designed all of the tests. You do not have to rerun the model to access this information.
- Flexible Test Naming: RBT now allows you to set a default for test case names for a graph. Previously tests were just named Test 1, Test 2, etc. You can have different user defined test name defaults for new tests versus those in a Test File. You can even modify the name of an individual test.
- Next Generation RBT Engine: To accomplish many of the above features the entire RBT engine was re-architected. We also rewrote the engine to better position RBT for integration with Requirements Management tools in the future – e.g. the ability to automatically generate the graph from the requirements. The new engine is usually slightly faster than the old one.
- File Conversion: You can bring an old RBT file into Release 8. It will then convert the old Access data base structure into the new XML data base. The old file is saved off as an MDB file. You can also run the bulk conversion utility which will convert all of your RBT, CEG, D_B files into the new XML based RBT file.
- New Cause-Effect Graphing User Guide: The User Guide has been upgraded to reflect all of the new functionality.
- New Help Support: The embedded Help has been upgraded to reflect all of the new functionality. The Help feature is now also available in the front end drawing component.
- Check Graph: As you are building the graph you can check to see if there are any basic issues before compiling it. The Check Graph feature will identify such things as orphaned nodes and Constraints that have been improperly set up.
- Check Overlap: When you move objects around on the drawing grid you might accidently place one on top of another. This is especially true when you copy/paste objects from another model. The Check Overlap feature identifies where this has happened and automatically corrects it.
- Scrollable Reports: In Release 7 there were a number of reports that were not scrollable. All reports are now scrollable (obviously long overdue).
The following materials present more detail about the BenderRBT tool:
Bender-RBT-Product-Overview
BenderRBT-V8-0-Data-Sheet (PDF file, 420K)
BenderRBT-Tool-Benefits (PDF file, 111K)
BenderRBT-Release-8-whats-new (PDF file, 22kb)
HOME/ RETURN TO MENU SELECTION